

Multinational healthcare company Johnson & Johnson (NYSE:JNJ) beat Wall Street’s revenue expectations in Q2 CY2025, with sales up 5.8% year on year to $23.74 billion. The company’s full-year revenue guidance of $93.3 billion at the midpoint came in 2.1% above analysts’ estimates. Its non-GAAP profit of $2.77 per share was 3.2% above analysts’ consensus estimates.
Is now the time to buy Johnson & Johnson? Find out by accessing our full research report, it’s free.
Johnson & Johnson (JNJ) Q2 CY2025 Highlights:
- Revenue: $23.74 billion vs analyst estimates of $22.88 billion (5.8% year-on-year growth, 3.8% beat)
- Adjusted EPS: $2.77 vs analyst estimates of $2.68 (3.2% beat)
- The company lifted its revenue guidance for the full year to $93.3 billion at the midpoint from $92 billion, a 1.4% increase
- Management raised its full-year Adjusted EPS guidance to $10.85 at the midpoint, a 2.4% increase
- Operating Margin: 27.2%, in line with the same quarter last year
- Free Cash Flow Margin: 26.1%, up from 20.7% in the same quarter last year
- Organic Revenue rose 3% year on year (6.7% in the same quarter last year)
- Market Capitalization: $373.4 billion
NEW BRUNSWICK, N.J.--(BUSINESS WIRE)--Johnson & Johnson (NYSE: JNJ) announced today that Daniel Pinto, President, JPMorganChase, has been elected to its Board of Directors. “We are thrilled to have Daniel join Johnson & Johnson’s Board of Directors,” said Joaquin Duato, Chairman and Chief Executive Officer, Johnson & Johnson.
Company Overview
Founded in 1886 and known for its iconic red cross logo, Johnson & Johnson (NYSE:JNJ) is a global healthcare company that develops and sells pharmaceuticals, medical devices, and technologies focused on human health and well-being.
Revenue Growth
A company’s long-term performance is an indicator of its overall quality. Any business can put up a good quarter or two, but many enduring ones grow for years. Regrettably, Johnson & Johnson’s sales grew at a mediocre 6.4% compounded annual growth rate over the last five years. This fell short of our benchmark for the healthcare sector and is a rough starting point for our analysis.
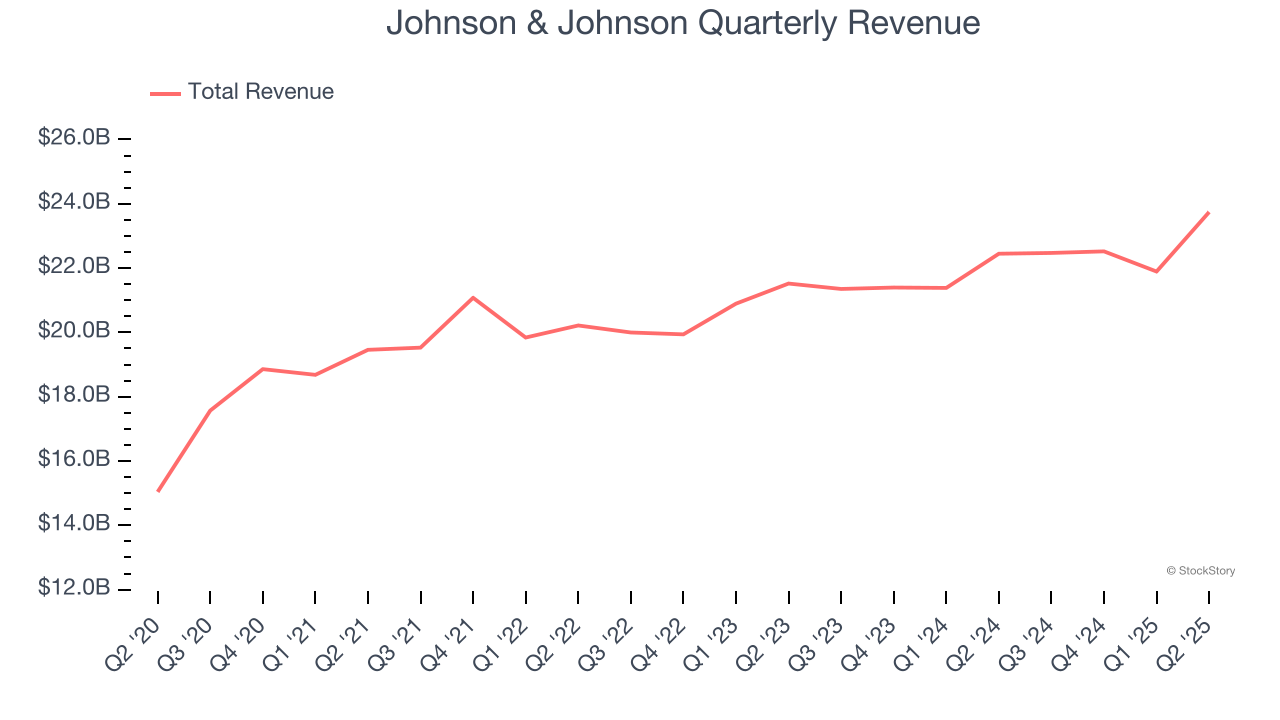
Long-term growth is the most important, but within healthcare, a half-decade historical view may miss new innovations or demand cycles. Johnson & Johnson’s recent performance shows its demand has slowed as its annualized revenue growth of 4.9% over the last two years was below its five-year trend. 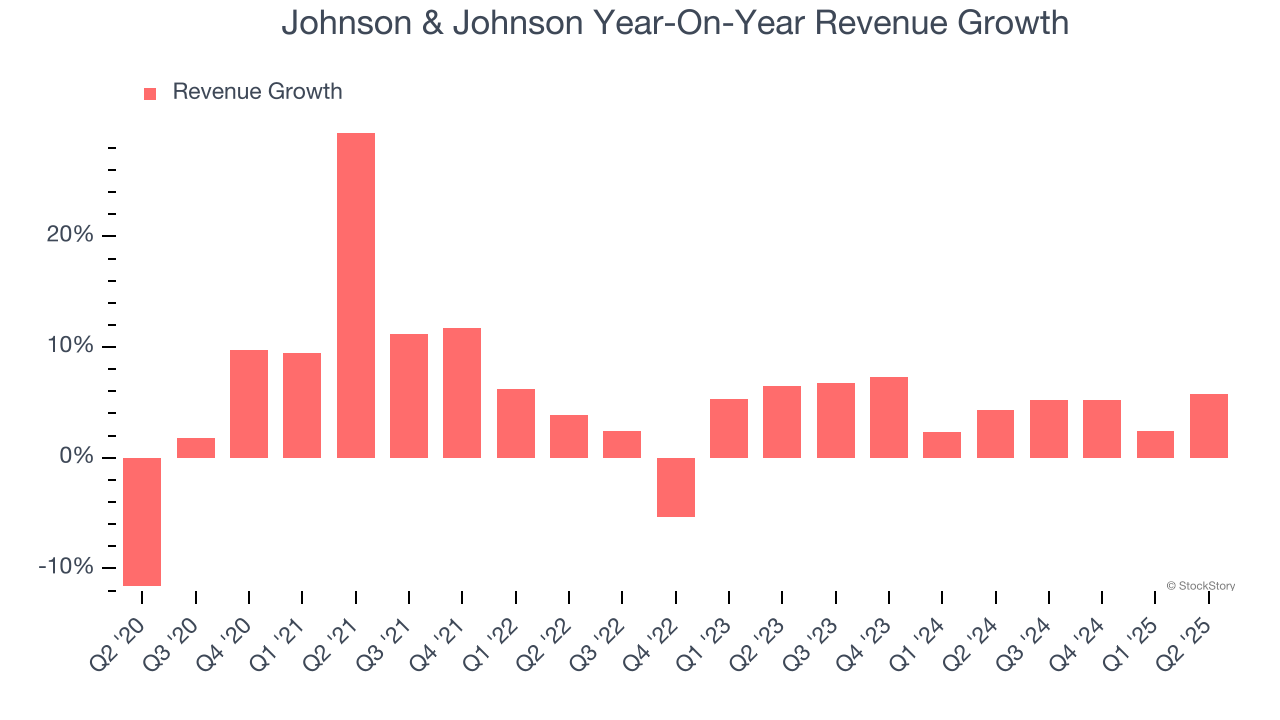
We can dig further into the company’s sales dynamics by analyzing its organic revenue, which strips out one-time events like acquisitions and currency fluctuations that don’t accurately reflect its fundamentals. Over the last two years, Johnson & Johnson’s organic revenue averaged 5% year-on-year growth. Because this number aligns with its normal revenue growth, we can see the company’s core operations (not acquisitions and divestitures) drove most of its results. 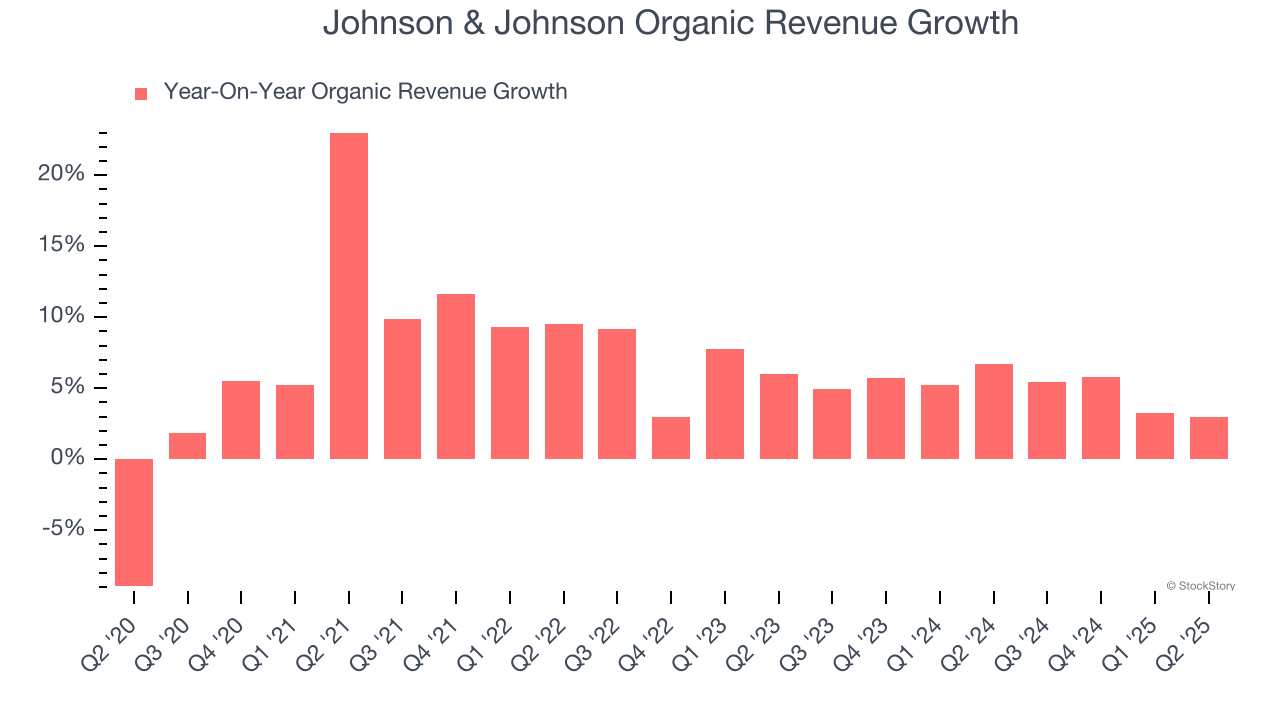
This quarter, Johnson & Johnson reported year-on-year revenue growth of 5.8%, and its $23.74 billion of revenue exceeded Wall Street’s estimates by 3.8%.
Looking ahead, sell-side analysts expect revenue to grow 2.9% over the next 12 months, a slight deceleration versus the last two years. This projection doesn't excite us and implies its products and services will see some demand headwinds.
Software is eating the world and there is virtually no industry left that has been untouched by it. That drives increasing demand for tools helping software developers do their jobs, whether it be monitoring critical cloud infrastructure, integrating audio and video functionality, or ensuring smooth content streaming. Click here to access a free report on our 3 favorite stocks to play this generational megatrend.
Operating Margin
Johnson & Johnson has been an efficient company over the last five years. It was one of the more profitable businesses in the healthcare sector, boasting an average operating margin of 28.1%.
Looking at the trend in its profitability, Johnson & Johnson’s operating margin decreased by 14 percentage points over the last five years. The company’s two-year trajectory also shows it failed to get its profitability back to the peak as its margin fell by 2.8 percentage points. This performance was poor no matter how you look at it - it shows its expenses were rising and it couldn’t pass those costs onto its customers.
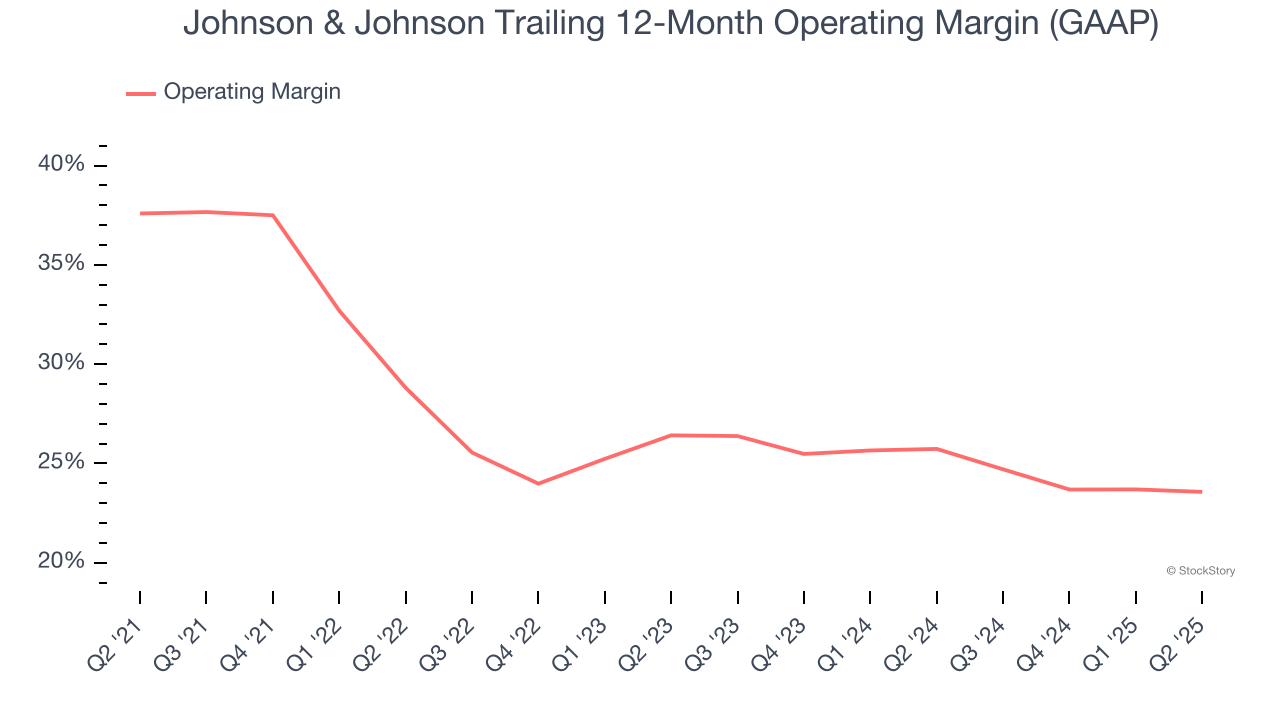
In Q2, Johnson & Johnson generated an operating margin profit margin of 27.2%, in line with the same quarter last year. This indicates the company’s overall cost structure has been relatively stable.
Earnings Per Share
We track the long-term change in earnings per share (EPS) for the same reason as long-term revenue growth. Compared to revenue, however, EPS highlights whether a company’s growth is profitable.
Johnson & Johnson’s unimpressive 4.6% annual EPS growth over the last five years aligns with its revenue performance. This tells us it maintained its per-share profitability as it expanded.
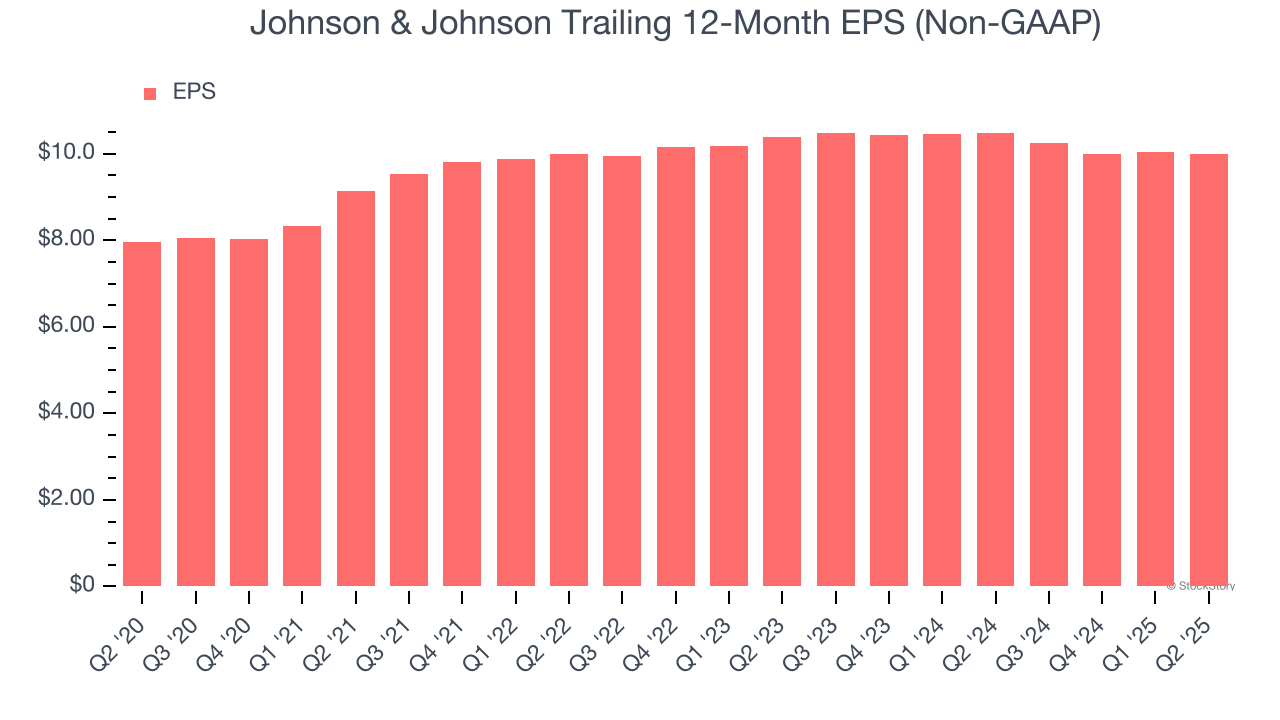
In Q2, Johnson & Johnson reported EPS at $2.77, down from $2.82 in the same quarter last year. Despite falling year on year, this print beat analysts’ estimates by 3.2%. Over the next 12 months, Wall Street expects Johnson & Johnson’s full-year EPS of $10 to grow 6.6%.
Key Takeaways from Johnson & Johnson’s Q2 Results
We enjoyed seeing Johnson & Johnson beat analysts’ revenue expectations this quarter. We were also glad its full-year revenue guidance exceeded Wall Street’s estimates. Zooming out, we think this quarter featured some important positives. The stock traded up 2.2% to $158.61 immediately after reporting.
Johnson & Johnson put up rock-solid earnings, but one quarter doesn’t necessarily make the stock a buy. Let’s see if this is a good investment. If you’re making that decision, you should consider the bigger picture of valuation, business qualities, as well as the latest earnings. We cover that in our actionable full research report which you can read here, it’s free.